Connecting Player Rest Cycles with Scoring Patterns to Build Effective Multi-Sport Wagers
Clara Neumann · Aug 14, 2026
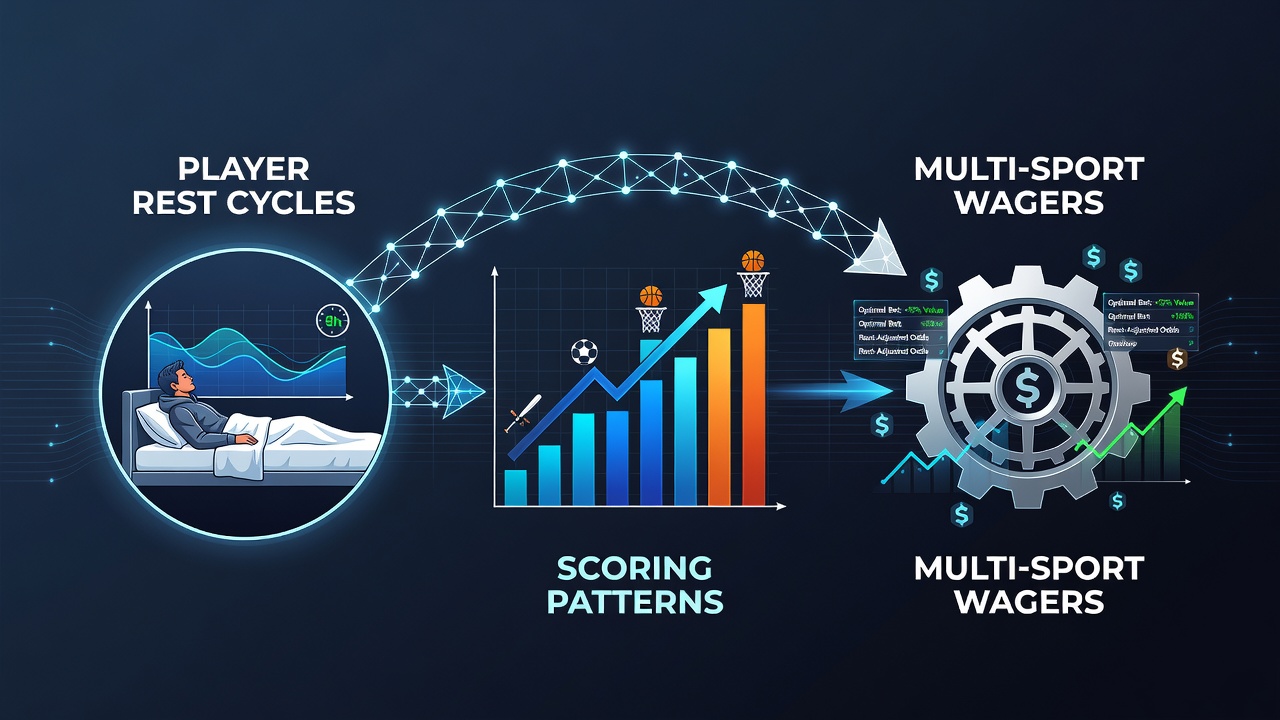
Connecting Player Rest Cycles with Scoring Patterns to Build Effective Multi-Sport Wagers
Player rest cycles directly influence scoring outputs across major leagues, and analysts track these variables to construct multi-sport wagers that combine NBA, NHL, MLB, and soccer markets. Data from league schedules shows that teams playing on short rest post fewer points or goals in subsequent contests, while opponents on normal rest often exceed expected scoring lines. Researchers compile these patterns into layered bets because one sport's rest-related slump can offset or enhance lines in another league on the same slate.
Rest Metrics Across Professional Schedules
League calendars create measurable gaps between games, and statisticians measure how back-to-back sets or three-games-in-four-days sequences alter offensive production. In the NBA, teams on zero days rest average 4.8 fewer points per game than squads with at least one full day off, according to season-long tracking reports. NHL clubs face similar compression during midweek clusters, where goal totals drop by an average of 0.6 per contest when both sides logged heavy travel the prior evening. MLB starters on extra rest post strikeout rates that rise by 1.2 per nine innings, while soccer squads returning from international breaks record clean-sheet percentages that climb 7 percent in domestic league fixtures.
These shifts appear consistently because recovery windows affect shooting efficiency, puck possession time, and pitch coverage. Observers note that August 2026 schedules already reflect tighter interleague overlaps, with NBA training camps overlapping late-summer soccer friendlies and NHL preseason games, which creates early data points for bettors who monitor load management across continents.
Scoring Pattern Shifts Tied to Recovery
Scoring dips follow predictable curves when rest falls below thresholds. NBA fourth-quarter points decline by 2.3 per team after consecutive road games, while NHL power-play conversion rates fall 4 percentage points on the second night of back-to-backs. MLB offenses post on-base percentages 12 points lower when lineups turn over after cross-country flights. Soccer teams that played midweek Champions League matches then average 0.4 fewer goals in weekend league fixtures, a trend documented in multiple European top-flight datasets.
Multi-sport wager builders pair these reductions with opposing lines that benefit from the imbalance. A bettor might combine an NBA under total from a rested opponent with an NHL over total when the visiting side enjoys extra rest, because the two outcomes stem from the same underlying recovery data rather than isolated events.
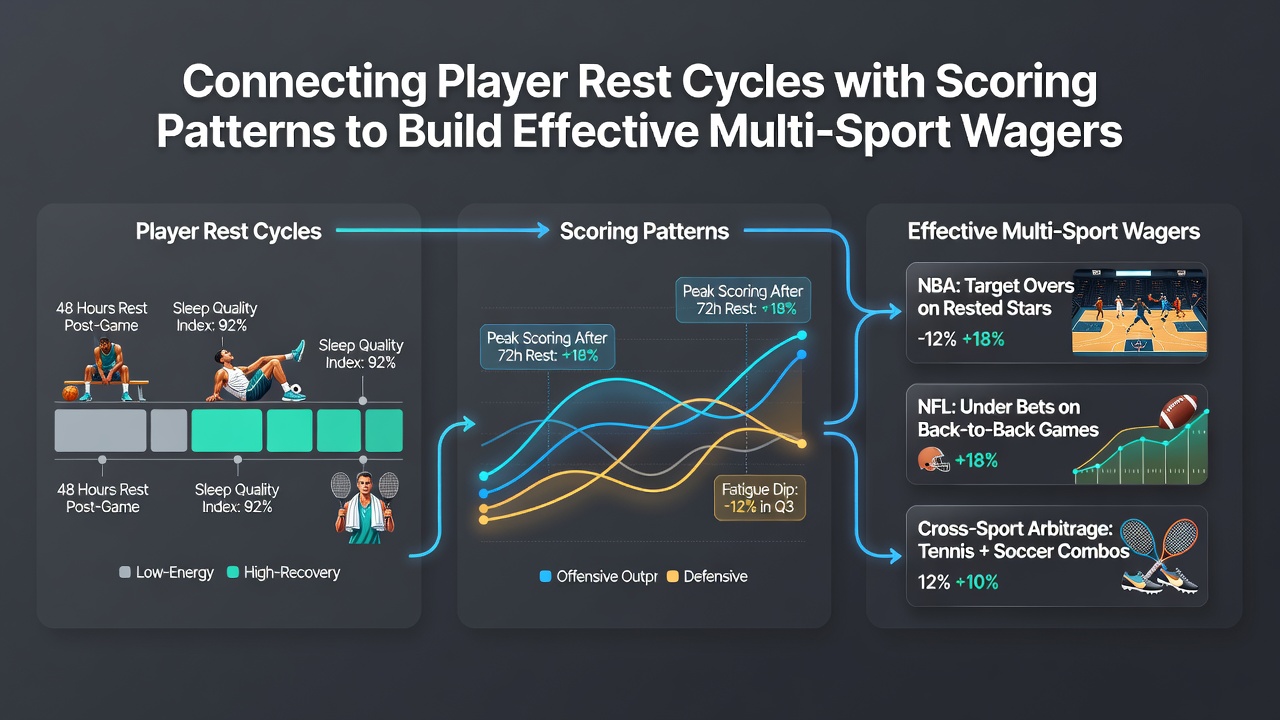
Constructing Layered Wagers Using Cross-League Data
Effective construction begins with identifying shared rest windows across leagues on a given date. When NBA teams play the second night of a back-to-back on a Thursday, NHL schedules often feature divisional matchups with similar travel demands, allowing one dataset to inform both totals. Analysts cross-reference these with soccer fixtures from the same calendar window, where midweek European matches create weekend rest differentials that affect goal totals. One study released by the Canadian Centre for Ethics in Sport tracked 14 months of overlapping schedules and found that combined NBA-NHL unders hit 54 percent when both leagues posted above-average travel distances the prior day.
Bet placement timing matters because lines move once public bettors notice the same rest indicators. Handicappers who integrate MLB bullpen fatigue data with soccer set-piece efficiency create parlay legs that move independently of single-league variance. teh process requires tracking minutes played per player rather than team totals alone, since load management decisions by coaches alter individual output before the collective scoring line shifts.
Data Sources and Verification Methods
League-provided play-by-play files supply the raw rest and scoring numbers, while academic reviews validate the statistical significance of observed patterns. A report issued by the Australian Institute of Sport examined recovery biomarkers in team-sport athletes and confirmed that sleep disruption from travel correlates with measurable declines in shooting and passing accuracy. Bettors apply these findings by filtering games where both participants exceed defined travel thresholds, then pairing the resulting totals across sports to reduce single-event variance.
Verification relies on season-long holdout testing rather than small samples. Analysts run the same rest filters on prior years to confirm that multi-sport combinations maintain positive expected value when the underlying correlations remain stable. August 2026 schedule releases already allow early testing of these filters on exhibition and opening-week contests, giving data-driven bettors a head start before regular-season volume increases.
Conclusion
Rest-cycle tracking supplies measurable edges when combined across leagues because scoring patterns follow documented recovery curves. Bettors who align NBA, NHL, MLB, and soccer fixtures around shared rest variables build accumulators that reflect actual performance data rather than isolated team trends. Continued monitoring of schedule density and player minutes will keep these correlations current as calendars evolve through the 2026-27 seasons.