Cross-League Recovery Windows: How Back-to-Back Burdens in the NBA Align with Quick-Start NHL Schedules to Guide Midweek Wager Construction
Riley Walter · May 22, 2026
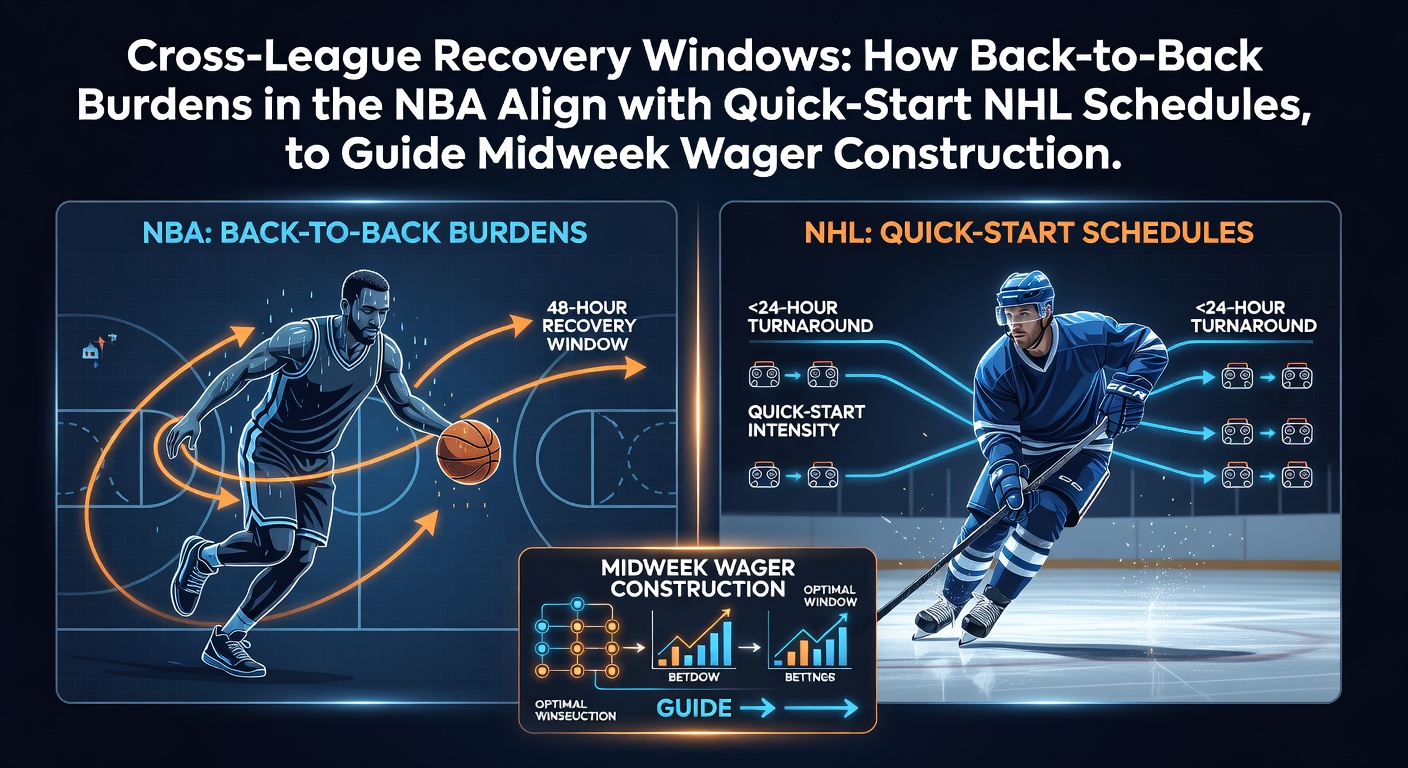
Cross-League Recovery Windows: How Back-to-Back Burdens in the NBA Align with Quick-Start NHL Schedules to Guide Midweek Wager Construction
Observers tracking professional sports calendars note that NBA back-to-back games create measurable recovery challenges for teams while NHL schedules often feature rapid turnarounds early in the week, and these patterns intersect during midweek betting windows in ways that reward careful analysis of rest differentials. Data from league schedules shows that NBA squads playing consecutive nights travel more frequently and log higher minutes per player, whereas NHL clubs launching into dense stretches accumulate fatigue through shorter recovery intervals between contests.
NBA Back-to-Back Patterns and Their Measurable Effects
League records indicate that teams facing back-to-backs in the NBA encounter elevated usage rates for key rotation players, with studies of historical performance revealing drops in shooting efficiency and defensive metrics when rest falls below 24 hours between tip-offs. Researchers examining box score trends across multiple seasons found that road back-to-backs correlate with higher turnover rates and reduced rebounding percentages compared to teams enjoying at least one full day between games. Those patterns become especially pronounced during March and April when schedules tighten ahead of playoff positioning battles, and analysts compile these rest metrics to adjust projected margins for midweek matchups.
What's notable is how travel distance compounds the burden, since cross-country flights after evening games leave limited time for physical recovery protocols such as sleep optimization and treatment sessions. Figures released by team medical staffs show increased soft-tissue strain reports following these compressed windows, and bettors reviewing injury reports alongside schedule density gain context for total points or player prop adjustments.
NHL Quick-Start Scheduling and Recovery Overlaps
NHL calendars frequently position games on consecutive nights early in the week, with data indicating that teams playing Monday and Tuesday contests face similar fatigue accumulation as NBA squads handling back-to-backs. Schedule grids from recent campaigns reveal clusters of quick starts after weekend breaks, and performance trackers document slight declines in save percentages and even-strength scoring when goalies and skaters log heavy minutes without adequate downtime. Observers comparing Eastern and Western Conference schedules point out that Pacific Division clubs often absorb more travel during these stretches, which aligns with observable shifts in special-teams efficiency.
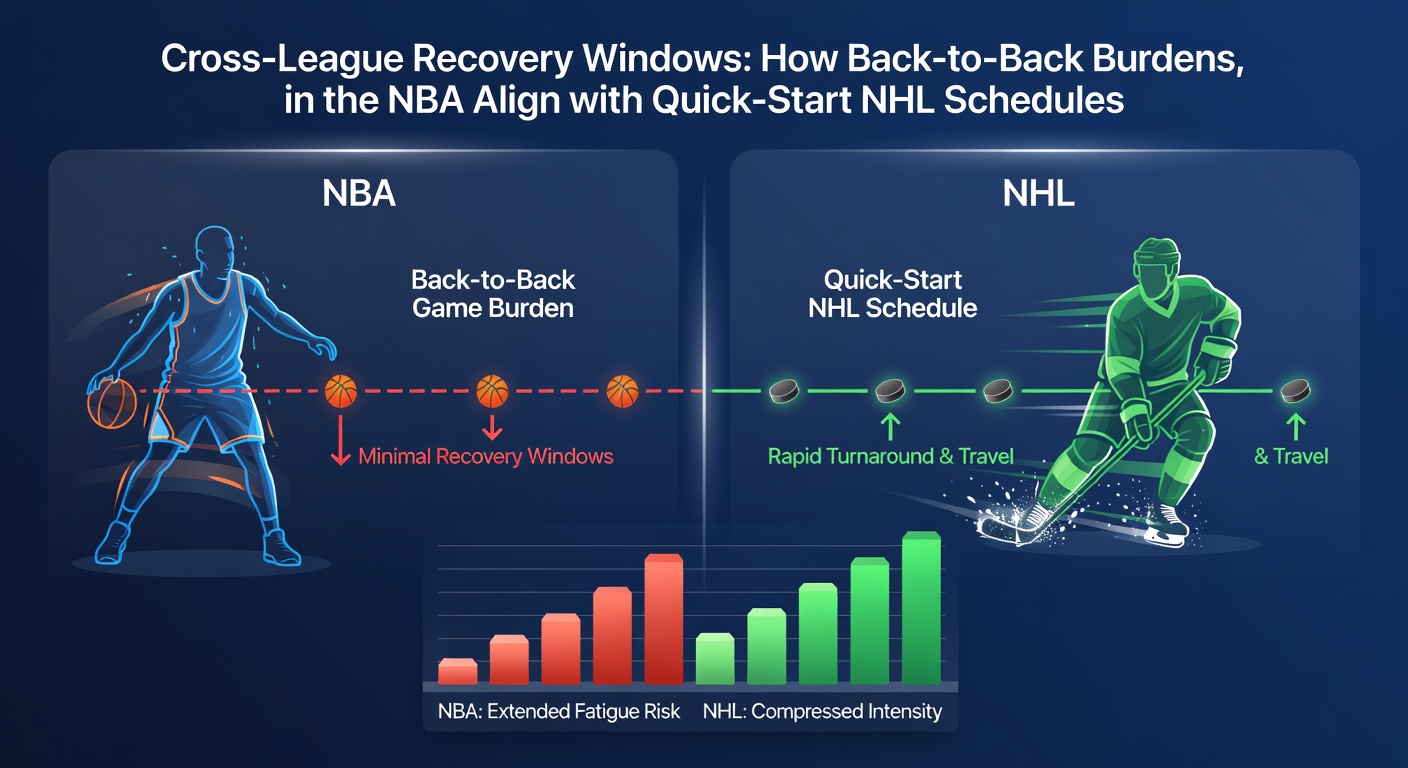
Analysts cross-reference these timelines with betting markets to identify where totals lean lower or where underdog value emerges when one club benefits from extra rest relative to its opponent. Research on workload management across both leagues highlights that goaltenders and star forwards show the clearest statistical responses to reduced recovery time, allowing for targeted prop considerations in midweek NHL slates that coincide with NBA doubleheaders.
Aligning the Two Leagues for Midweek Wager Construction
Schedule databases demonstrate that NBA and NHL calendars occasionally overlap in dense midweek periods, particularly when both leagues schedule Tuesday and Wednesday games following Monday off-nights. Data indicates that NBA teams returning from back-to-backs often face opponents enjoying normal rest, and parallel NHL quick-start sequences create comparable imbalances that influence totals and moneyline movements. Those constructing wagers review rest differentials across both sports simultaneously because correlated fatigue patterns can inform parlay structures or same-game adjustments when multiple leagues contribute to a single betting card.
According to schedule analysis tools maintained by sports data providers, May 2026 featured several midweek clusters where NBA playoff teams carried residual back-to-back effects into subsequent rounds while NHL clubs navigated compressed regular-season finales. Bettors examining these alignments use historical averages for points scored or goals allowed under specific rest conditions to refine projections rather than relying on season-long trends alone. External reports from organizations such as the NHL scheduling archive and academic workload studies further support these layered approaches by supplying granular rest and travel metrics that sharpen edge identification.
Practical Data Integration and Market Timing
Performance databases reveal that combining NBA back-to-back indicators with NHL quick-start metrics produces clearer signals for midweek totals than isolated league analysis. Researchers compiling multi-season datasets note consistent directional tendencies in scoring when aggregate rest falls below league norms, and these tendencies guide adjustments to implied probabilities in betting exchanges. People reviewing daily line movements observe that sharp action often follows publication of updated injury and rest reports, which in turn reflect the cumulative schedule burdens across both sports.
Case examples from prior seasons show teams navigating dual back-to-back and quick-start sequences posting altered offensive outputs that deviate from seasonal baselines, and these deviations feed into model refinements used by professional handicappers. Observers emphasize that timing remains critical since lines adjust rapidly once schedule-derived data circulates through betting platforms.
Conclusion
Schedule patterns across the NBA and NHL create recurring recovery windows that intersect most visibly during midweek periods, and systematic review of back-to-back burdens alongside quick-start sequences supplies concrete inputs for wager construction. Data from league archives and performance studies continues to illustrate how rest differentials influence statistical outputs, allowing for informed adjustments that align with observed market behavior in both sports.