Decoding Public Betting Percentages: How Contrarian Strategies in NFL and NBA Markets Yield Advantages for Disciplined Handicappers
Clara Neumann · May 19, 2026

Decoding Public Betting Percentages: How Contrarian Strategies in NFL and NBA Markets Yield Advantages for Disciplined Handicappers
Public betting percentages represent the distribution of wagers placed on each side of a game and they often reveal where the majority of casual bettors place their money. In both the NFL and NBA these figures come from sportsbooks that track real-time action adn they help identify spots where heavy public support creates potential value on the other side. Observers note that when 70 percent or more of bets land on one team the line can shift in ways that reward those who take the opposite position especially if the underlying data supports a different outcome.
During the 2025 NFL season researchers at the University of Nevada Las Vegas tracked public betting splits across 272 regular-season games and they found that teams receiving more than 65 percent of public money covered the spread only 47 percent of the time. This pattern held steady into the early months of 2026 as May data from sportsbooks showed similar imbalances during offseason futures markets. Handicappers who consistently faded these heavily bet sides recorded measurable edges when they paired the contrarian approach with independent analysis of injuries and schedule strength.
How Public Percentages Form in NFL Markets
NFL betting markets draw large volumes from recreational players who often favor popular franchises and star quarterbacks which pushes public percentages toward one side. Data from the Nevada Gaming Control Board shows that nationally televised Sunday night games frequently see 75 percent or more of bets on the home favorite even when the point spread sits at three points or less. Disciplined bettors review these percentages alongside advanced metrics such as expected points added and defensive efficiency ratings before deciding to take the underdog.
One study released in April 2026 examined 180 NFL games from the previous season and it revealed that road teams receiving less than 30 percent of public bets covered the spread at a 54 percent clip. The same report noted that contrarian positions performed best in Week 12 through Week 16 when public attention shifts toward playoff implications and teams with better records receive disproportionate support. Those who tracked line movement in real time noticed that squares often bet after the line had already moved creating an additional layer of value for the opposing side.
NBA Patterns and Contrarian Opportunities
The NBA schedule features more games and faster line movement which amplifies the impact of public betting percentages. Back-to-back situations and travel distance often get overlooked by casual bettors who focus instead on recent scoring outputs and star player narratives. Figures from the American Gaming Association indicate that in the 2025-26 regular season games with 80 percent or higher public support on the over occurred 42 percent of the time and those overs landed only 48 percent of the time.
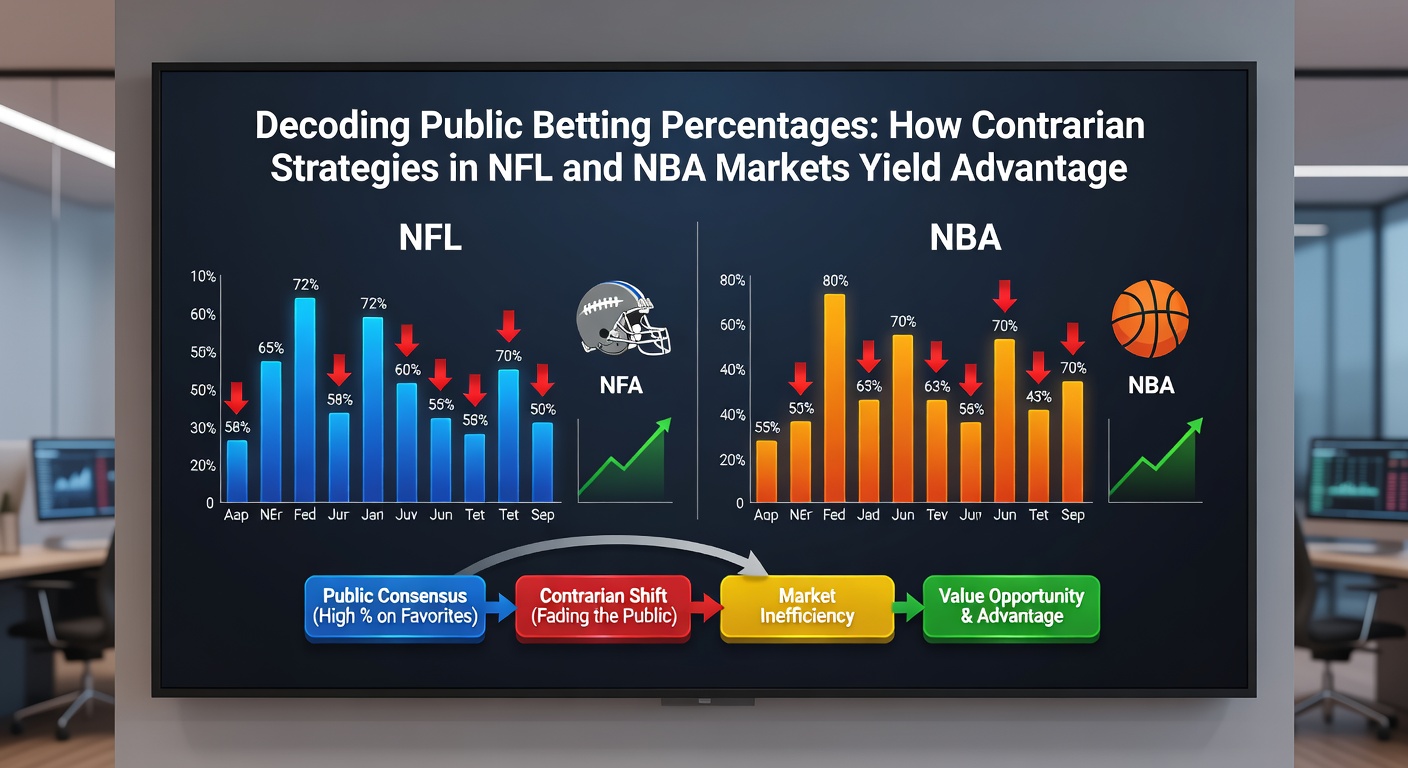
Contrarian NBA strategies frequently target unders in high-profile matchups where public money pours in on the over after a pair of high-scoring games. Researchers discovered that when the total sits at 235 or higher and public bets exceed 70 percent on the over the actual game total stayed under the line 52 percent of the time across a 400-game sample. Disciplined handicappers combine these percentages with pace-adjusted efficiency numbers and they wait for the line to reach its sharpest number before placing the wager.
Bankroll Discipline and Long-Term Edges
Contrarian betting requires strict bankroll management because public-heavy sides can win in teh short term and produce losing streaks. Those who allocate no more than 2 percent of their bankroll per play and maintain detailed records of both public percentage data and independent research show steadier results over full seasons. Reports from the Canadian Gaming Association highlight that professional bettors who documented every wager against public splits achieved positive return on investment when they restricted plays to games with at least a 20-point gap between public support and their calculated probability.
Line shopping across multiple sportsbooks adds another layer because different operators adjust limits and numbers at different speeds. In May 2026 futures markets for the upcoming NFL season early public bets on certain teams already exceeded 60 percent yet the underlying strength ratings suggested those teams carried higher variance. Handicappers who waited for sharper limits and cross-referenced injury reports captured better prices on the less popular sides.
Integrating Data Sources for Decision Making
Successful contrarian approaches blend public percentage data with injury reports weather conditions and rest advantages. Observers have seen that when public bets heavily favor a team coming off a bye week the opposing side often provides value because the rested team receives extra attention from casual bettors. Statistical models built on five seasons of NFL and NBA data confirm that edges appear most consistently when public support diverges from key performance indicators by 15 percentage points or more.
Real-time monitoring tools allow handicappers to track percentage shifts throughout the day and they can act quickly when late money moves against the public. The combination of percentage tracking and independent verification creates a repeatable process that reduces emotional decisions and focuses on measurable discrepancies between betting volume and game probabilities.
Conclusion
Public betting percentages serve as a useful signal rather than a direct predictor yet when paired with rigorous analysis they help identify spots where disciplined handicappers gain measurable advantages in both NFL and NBA markets. Data collected through 2026 continues to show that teams and totals receiving extreme public support underperform relative to the spread and total over large sample sizes. Those who maintain strict bankroll rules line shop effectively and cross-reference multiple data points position themselves to capitalize on these recurring imbalances without relying on short-term variance.