Rest Cycles and Performance Dips: Linking Consecutive Game Burdens in Professional Hockey and Baseball for Informed Daily Selections
Rafael Wagner · Aug 4, 2026
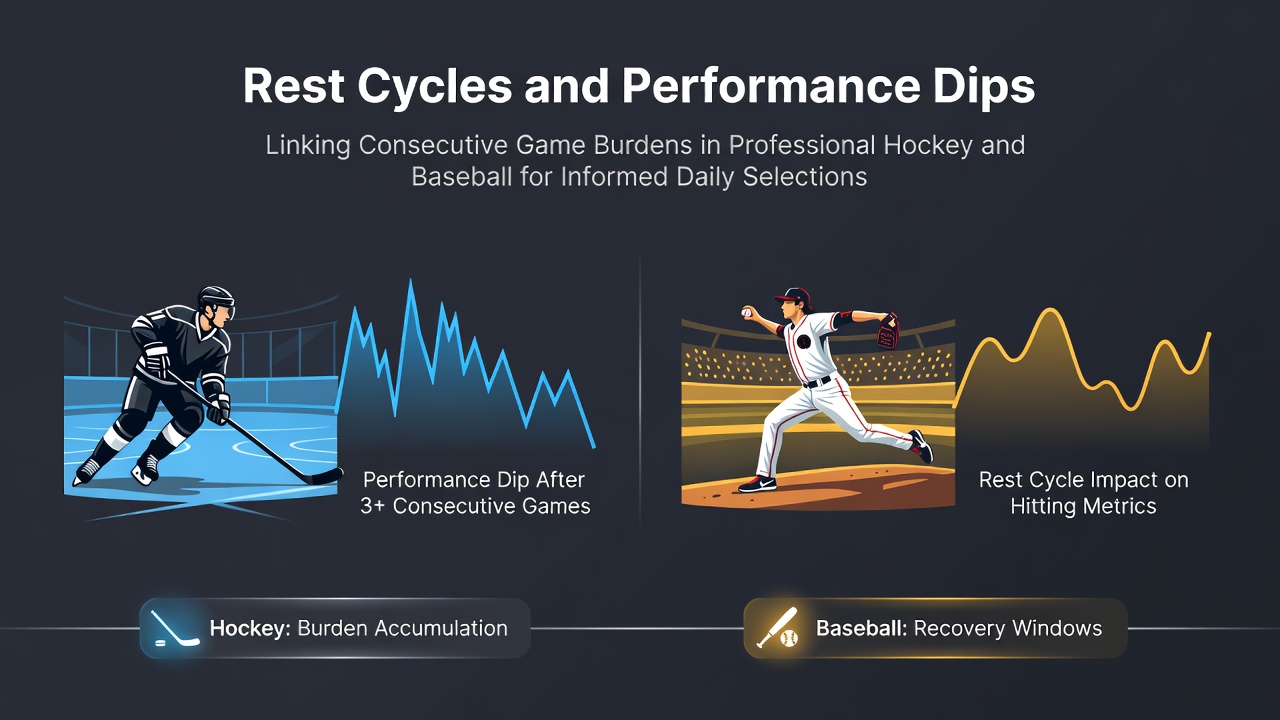
Rest Cycles and Performance Dips: Linking Consecutive Game Burdens in Professional Hockey and Baseball for Informed Daily Selections
Professional hockey and baseball schedules create recurring patterns of consecutive game burdens that affect player output across both leagues and these patterns become especially visible during peak periods such as the August stretch of the MLB calendar when teams play multiple series in quick succession while the NHL prepares for training camp demands after a compressed previous season.
Schedule Structures and Back-to-Back Patterns
The NHL constructs its regular season with clusters of back-to-back games that occur roughly twenty to twenty-five times per team each year and these stretches often coincide with travel across multiple time zones whereas MLB distributes its 162-game slate into series of three or four games that frequently require day-night doubleheaders or quick turnarounds between cities and both leagues therefore produce measurable windows where recovery time shrinks below optimal thresholds.
Data compiled by league tracking systems shows that NHL teams playing on consecutive nights record save percentages that drop by an average of 0.8 percentage points for starting goalies compared with their season norms while skaters exhibit reduced shot generation rates in the second game of such sets and similar metrics from MLB indicate that starting pitchers working on short rest of three days or fewer post a 0.45 increase in ERA relative to their four-day rest baselines according to aggregated season-long records.
Performance Indicators Across Positions
Researchers examining box-score and tracking data have identified position-specific responses to reduced rest cycles and in hockey the effect appears most pronounced among goaltenders who log heavy minutes while defensemen show smaller but consistent declines in zone-exit success rates and forwards maintain scoring output more steadily yet accumulate higher penalty minutes in the follow-up contest. Baseball exhibits parallel trends where catchers and middle infielders demonstrate elevated error rates after doubleheaders and outfielders maintain range factors more reliably although power numbers dip when lineups turn over multiple times within a week.
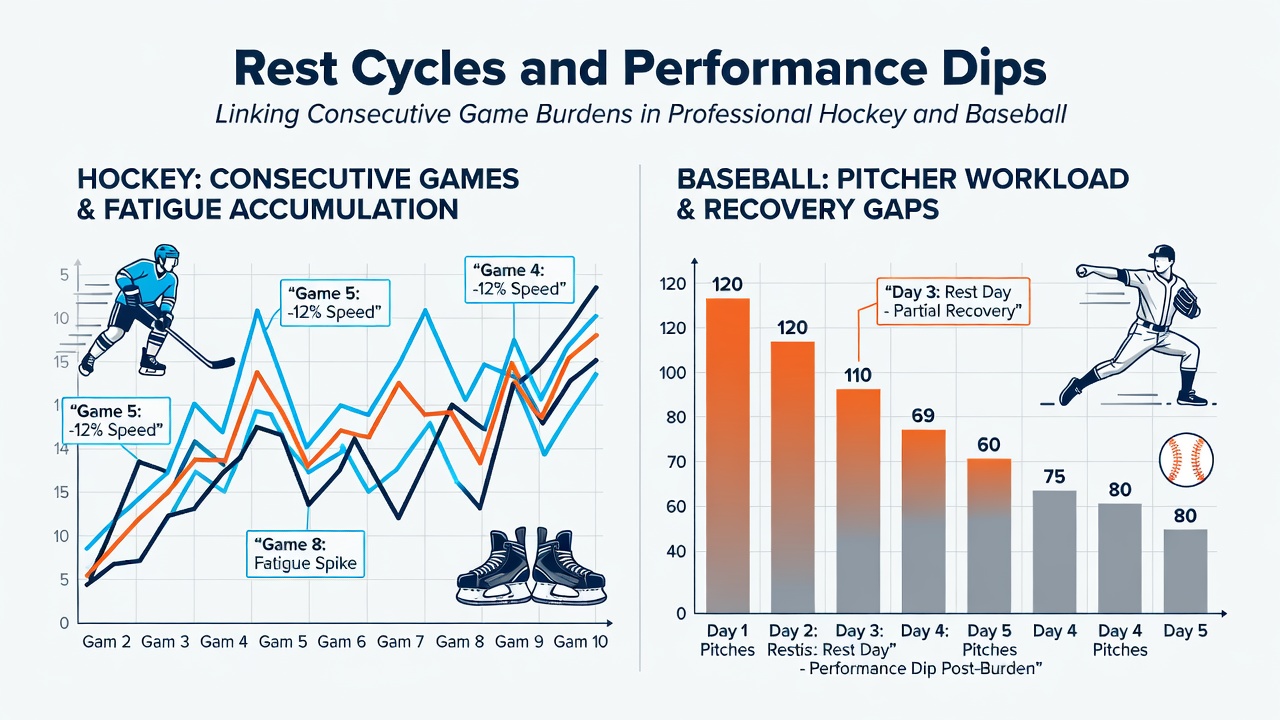
Studies from sports science programs at Canadian universities have tracked heart-rate recovery and sleep metrics in NHL players during back-to-back sequences and these findings align with separate analyses from U.S.-based biomechanics labs that monitor pitch velocity decay in MLB starters working on compressed schedules and both bodies of work point to overlapping windows of vulnerability that span roughly twenty-four to forty-eight hours after the initial high-load outing.
Connecting Burdens for Daily Selections
Handicappers examining daily slates can cross-reference NHL back-to-back situations with MLB series that feature pitchers on short rest and this linkage reveals clusters where underdog or total outcomes occur at elevated rates because the cumulative fatigue load affects both ends of the ice and the diamond simultaneously and schedule density reports released by the leagues each spring provide advance notice of these overlapping periods well before the games occur.
League-wide figures reveal that NHL road teams in the second game of back-to-backs cover the puck line at a lower rate than their season average while MLB visitors facing a starter on three days rest record on-base percentages that fall below their established marks and these directional shifts create opportunities to layer selections across the two sports when the calendars align during summer and early fall months.
Recovery Windows and External Factors
Travel distance and venue altitude further modulate the impact of consecutive burdens and teams crossing multiple time zones for an NHL back-to-back show larger dips in expected goals than those remaining within the same division whereas MLB clubs playing at high-elevation parks after a cross-country flight exhibit amplified strikeout rates for their pitchers on reduced rest and analysts who integrate these variables into models produce more stable projections for daily wager construction.
August 2026 marks another period when MLB schedules intensify before the postseason while NHL clubs begin exhibition preparations and observers monitoring both calendars note that historical data from similar late-summer windows continues to show the same directional patterns in performance metrics tied to rest cycles.
Conclusion
Rest cycles and consecutive game burdens generate predictable performance shifts in professional hockey and baseball and these shifts become actionable when schedule data from both leagues is examined together rather than in isolation and the resulting linkages support more precise daily selections across multiple sports without reliance on subjective judgment.