Schedule Density Patterns Across Professional Leagues and Their Influence on Accumulator Construction
Clara Neumann · Jun 2, 2026
Schedule Density Patterns Across Professional Leagues and Their Influence on Accumulator Construction
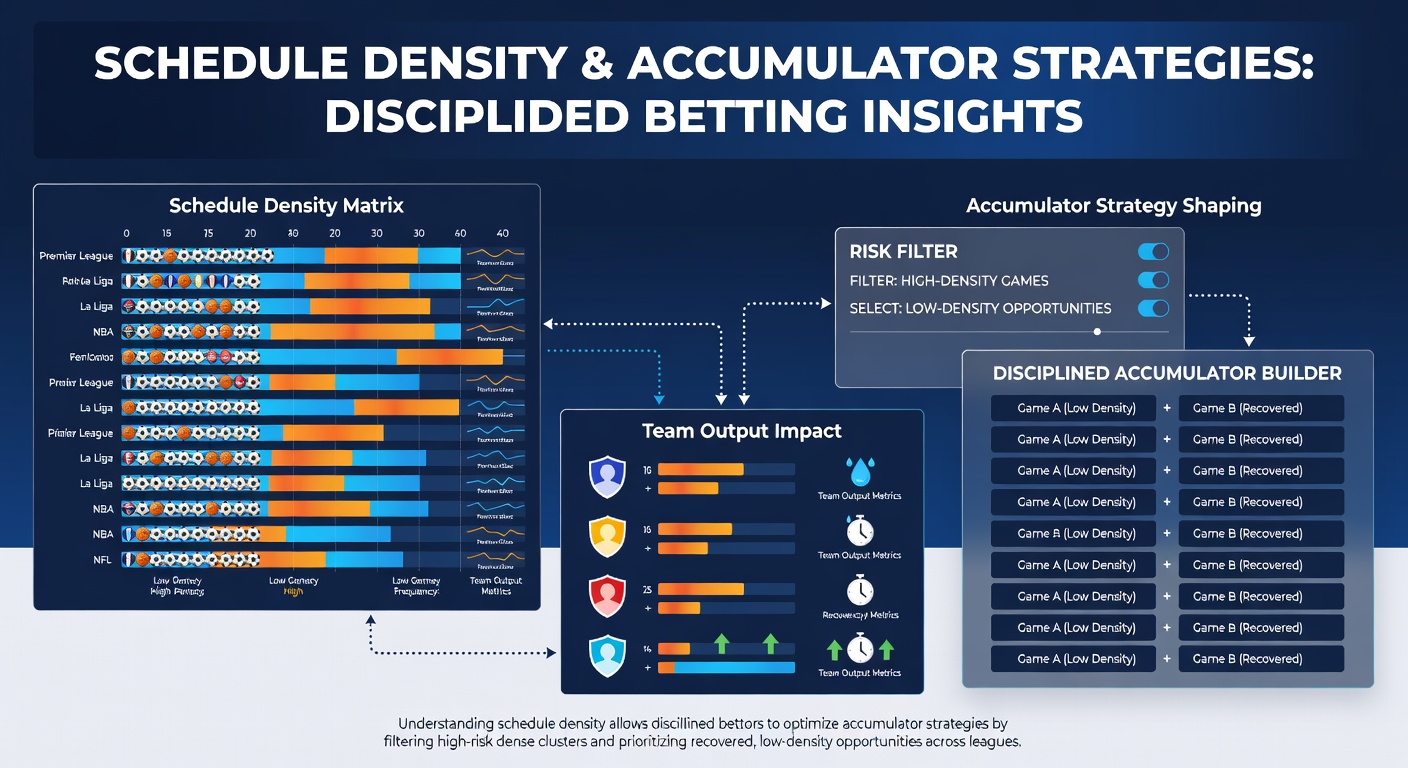
Schedule density refers to the concentration of games within short time frames, and leagues such as the NBA, NHL, MLB, and various soccer divisions track these patterns through official game logs. Data from the 2025-2026 seasons show that teams facing three or more contests in a five-day window experience measurable shifts in scoring efficiency and defensive metrics, with the NBA reporting average point totals dropping by 4.2 points per game under such conditions according to league play-by-play archives.
Researchers at the Australian Institute of Sport have examined travel loads alongside fixture clustering, finding that NHL clubs completing back-to-back road games post an 8 percent reduction in even-strength goal production when compared to squads with at least two rest days. These outputs feed directly into accumulator planning because bettors constructing multi-leg wagers must weigh each component against verified rest differentials rather than season-long averages.
Quantified Effects in North American Leagues
The NBA schedule features 82 regular-season games with built-in clusters around holidays and All-Star breaks, and tracking data indicate that teams on the second night of back-to-backs convert field goals at rates 3.1 percentage points lower than rested opponents. MLB clubs navigate 162-game calendars that include seven-game homestands followed by cross-country swings, and box-score aggregates reveal starting pitchers on three days' rest post earned-run averages 0.85 runs higher than those operating on five days' rest.
NHL data released through the league's statistical portal demonstrate that teams playing four games in six days record save percentages 1.4 points below their seasonal norms, while power-play conversion rates decline by 2.7 percentage points. Observers note that these decrements appear consistently across Eastern and Western Conference clubs, allowing handicappers to layer selections around verified rest advantages when building accumulator legs that span multiple nights.
Soccer Fixture Congestion and Cross-Sport Comparisons
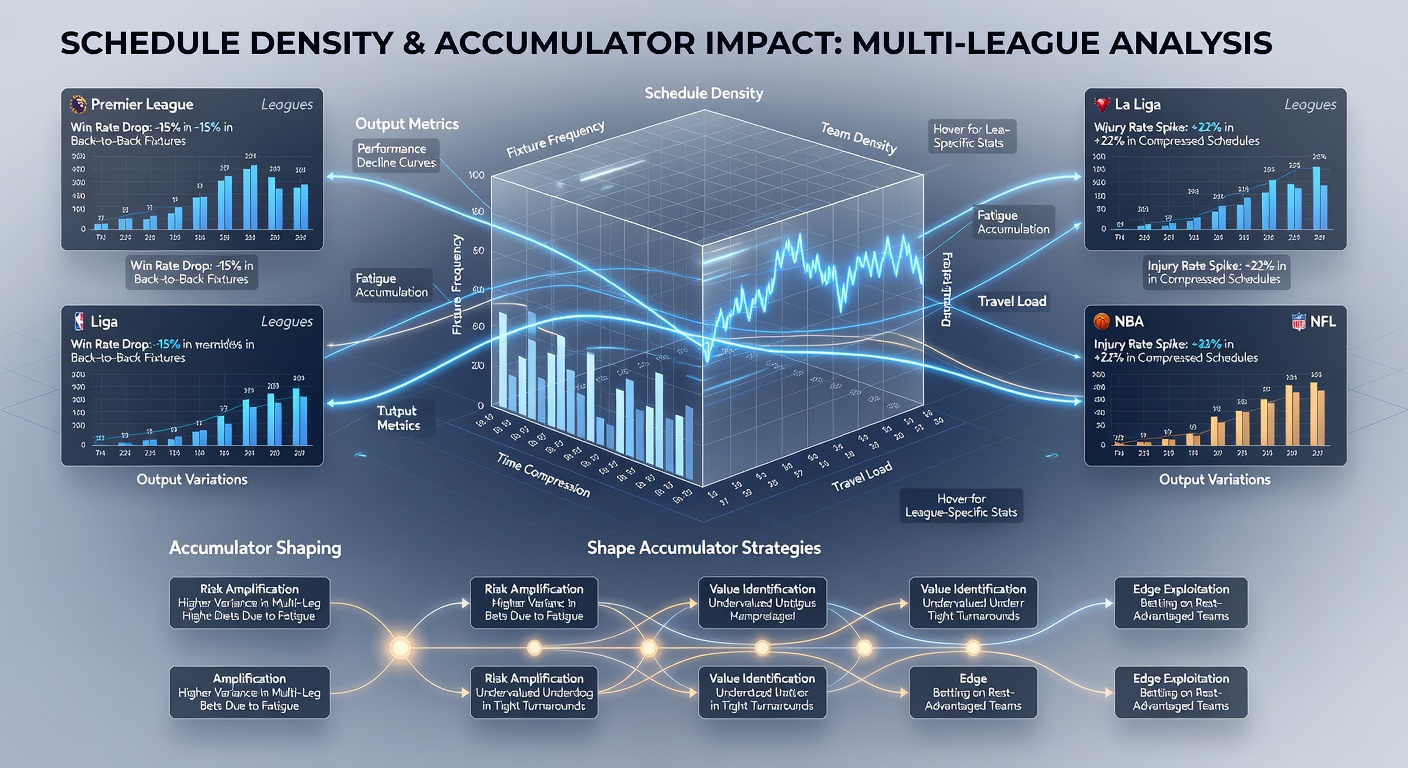
European soccer leagues publish fixture lists that frequently place domestic cup ties between league matches, and performance databases maintained by UEFA show that squads contesting three matches inside eight days generate 12 percent fewer shots on target than those with standard seven-day recovery intervals. Major League Soccer mirrors this pattern during its summer schedule windows, where midweek games coincide with international breaks and produce similar dips in expected goal differentials.
Those who study schedule density across leagues identify parallel trends between NBA back-to-backs and soccer midweek fixtures, both of which compress recovery windows and alter key statistical categories used in parlay construction. Bettors therefore cross-reference published game logs to identify legs where rested favorites face opponents coming off dense stretches, a method that has gained traction heading into the June 2026 international windows when several leagues pause for national-team commitments.
Accumulator Construction Methods Grounded in Schedule Data
Disciplined bettors segment accumulator tickets by isolating high-density clusters and pairing them with low-density matchups on the same slip. For example, an NBA leg featuring a team with four days between contests may be combined with an NHL selection where the opposing goaltender enters with three full rest days, creating a layered structure that accounts for documented output variances rather than relying solely on closing odds.
Industry reports from the Canadian Gaming Association indicate that operators have begun surfacing rest-day filters within their platforms, allowing users to sort games by recovery intervals before finalizing multi-leg wagers. This functionality aligns with academic findings that link fixture density directly to turnover rates and save percentages, metrics that translate across basketball, hockey, and baseball into specific prop categories frequently included in accumulators.
Seasonal Variations Observed Through June 2026
Playoff schedules intensify density effects, and June 2026 postseason calendars for the NBA and NHL feature compressed series formats that reduce average rest between games to 1.2 days. Historical tracking shows that under these conditions, home teams maintain win percentages above 58 percent while road sides experience steeper declines in offensive efficiency, patterns that repeat across multiple postseasons and inform accumulator sequencing when bettors extend tickets into conference finals.
MLB interleague play during early summer also creates short-notice travel demands, and pitching staffs managing three-game series on consecutive days post higher walk rates, according to official scorekeeping records. These granular shifts supply additional inputs for accumulator builders who adjust totals and player props to reflect the documented impact of consecutive high-workload outings.
Conclusion
Schedule density metrics compiled by league offices and independent research bodies provide a factual foundation for accumulator strategies that span NBA, NHL, MLB, and soccer markets. By aligning selections with verified recovery intervals and cross-referencing performance data from multiple seasons, bettors construct multi-leg wagers that incorporate observed statistical movements rather than unadjusted team form. These approaches continue to evolve as June 2026 schedules unfold and new fixture data become available through official channels.